3D Pixel Art Guide - Part 1
posted on 10 May 2026, updated on 15 May 2026

3D Pixel Art Guide by Bernard Perbal is licensed under a Creative Commons Attribution-ShareAlike 4.0 International License.
This page presents some technical details and explanations related to my approach to creating isometric 3D pixel art, particularly the dimensions of a basic cube, inclined planes, ellipses, and colors.
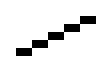
In isometric pixel art, lines are typically drawn using a stair-step pattern, where each step consists of 2 horizontal pixels for every 1 vertical pixel. This convention creates a clean, regular, and visually pleasing appearance. For example, a line spanning 10 horizontal pixels will have a vertical offset of 5 pixels.
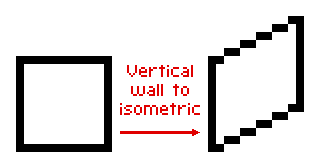
Example: below is a vertical wall built from a 12-pixel square.
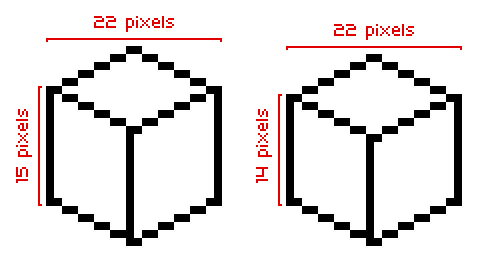
There are two types of representation for a simple object in 3D pixel art: Type A and Type B. Here is an example using a simple cube. Notice the central vertical line separating the left and right sides.
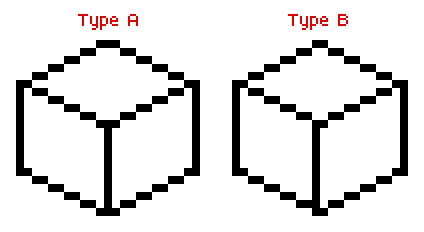
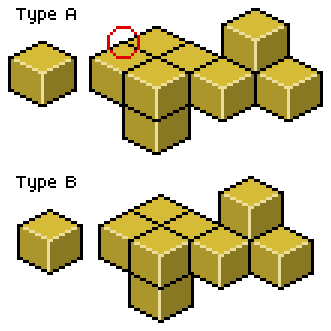
In general, Type B is preferred, as Type A can cause alignment issues on a grid due to the objects' odd-numbered width.
To draw a visually perfect cube, you can easily determine its height from the edge length of the square in 2D. Let's take an edge length of 2 units as an example.
Consider the following diagram. In red: 2 horizontal units for 1 vertical unit. In green: x, the edge length in isometric projection. And in black: the cube's top face viewed from above, where h represents both the edge length and the height of the cube:
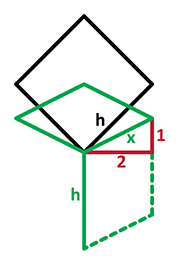
The first step is to calculate the projected edge length x in Pixel Art-style isometric projection, where the ratio is 2 horizontal pixels for every 1 vertical pixel.
This projected length is therefore:

In a top-down flat view, this length corresponds to the edge of a square rotated by 45 degrees, whose diagonal matches the cube's isometric height h. That height is:

As a result, the ratio between the isometric height h and the projected edge length x is:
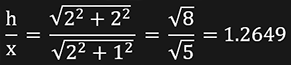
So, the ideal isometric cube height is approximately 1.2649 times the projected edge length.
Here is an example of a cube whose edge has a horizontal component of 12 pixels. The vertical component is therefore 6 pixels. The height calculation gives: 12 * 1.2649 = 15.1788 which is rounded to 15 pixels.
However, there is an important detail to keep in mind: in a 12-pixel cube, the left side overlaps the right side by 2 pixels. As a result, the total horizontal width of the cube is 22 pixels instead of 24.
To achieve a more visually accurate cubic appearance, the height should therefore be adjusted using: 22 * 1.2649 / 2 = 13.9139 rounded to 14 pixels.
3D Pixel Art Guide - Part 2
posted on 18 May 2026, updated on 20 May 2026
3D Pixel Art Guide by Bernard Perbal is licensed under a Creative Commons Attribution-ShareAlike 4.0 International License.
How should an isometric Pixel Art object be colored? Here are the standard techniques I use to maintain consistent shading and coloring throughout my 3D artwork. Following these guidelines helps produce clean, visually pleasing results and ensures that all elements remain coherent within the scene.
Naturally, lighting conditions can sometimes vary depending on the environment or the mood of a scene. Certain situations require special treatment and must therefore be handled on a case-by-case basis. There are also many other valid approaches and artistic conventions, each with their own advantages and stylistic choices.
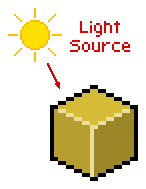
As a starting point, I assume a virtual light source positioned above the scene and slightly to the left. With this setup, the brightest part of an object is usually its top horizontal surface. This brightest tone becomes the reference color from which all other shades are derived.
The different surfaces of the object are then shaded according to their orientation relative to the light source. Horizontal surfaces receive the most light, while vertical planes appear darker overall.
Among the vertical surfaces, the planes facing toward the left receive more light and therefore appear brighter than those facing toward the right. This simple rule helps reinforce depth and volume while preserving the readability of the object.
Special attention must also be paid to the object's edges. Outer edges are generally highlighted with brighter colors in order to clearly separate adjacent surfaces and improve the silhouette of the object.
Inner edges, which occur less frequently, are usually rendered with darker tones. Even so, they should remain clearly visible and sufficiently contrasted so that the structure of the object remains easy to read.
We are going to use a graphics application that supports layers and opacity levels, such as Adobe Photoshop, in order to build a template that can be used to maintain consistent lighting and shading across objects. This template will be constructed using several separate layers organized as follows:
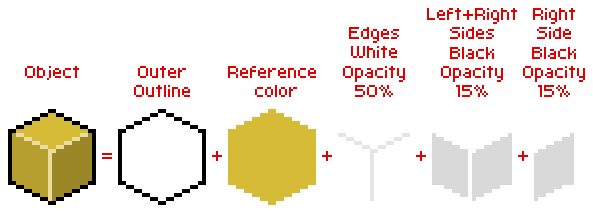
On the right-side surface, notice that a 15% opacity layer is applied twice. Be careful: applying two 15% opacity layers does not result in a total opacity of 30%.
In reality, the actual combined value is 27.75%:
- the first layer blocks 15% of the light, leaving 85%
- the second layer blocks 15% of what remains, so: 85% * 85% = 72.25% white remaining
- therefore the total black coverage is: 100 - 72.25 = 27.75%
Be careful not to recreate these opacity masks for every new object. The purpose of this template is simply to change the color of the 'reference color' layer, then use your application's Eyedropper tool to sample the generated colors for the various components (edges, left and right vertical surfaces) and apply them directly to your objects.
Here are a few examples of black, gray, and white cubes. Note that for a black object, you should not use pure black (RGB: 0, 0, 0) as the base color. This both helps distinguish the object's outline more clearly and allows brightness variations on the left and right vertical surfaces:

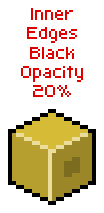
It can also be useful to add an extra layer to color the inner edges of an object. This layer should be placed over the right surface and filled with black set to 20% opacity.

When working with a cylinder, or any other curved object, the color shading must vary according to the orientation of the surface. To achieve this effect, intermediate RGB values are calculated between the color of a surface facing left and the color of a surface facing right.
In practice, the curved surface usually extends slightly beyond these two perpendicular reference planes. Additional gradient values must therefore also be calculated for these extended areas.
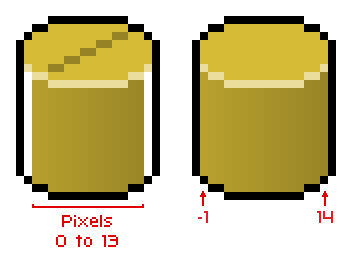
In the following example, the distance between the left-facing and right-facing reference planes of the cylinder is 14 pixels. These pixels are indexed from 0 to 13. The curved surface also extends by 1 extra pixel on each side: pixel -1 on the left and pixel 14 on the right.
All intermediate RGB values can easily be generated using a small calculation function implemented in any programming language. As an example, we provide an Excel spreadsheet along with a simple macro.
To generate the RGB table, simply enter:
- the distance between the two reference planes (14 pixels in this example),
- the number of extension pixels on the left and right sides (3 values are used here to increase the available color choices for the 1-pixel gaps on both sides),
- and the two RGB colors corresponding to the left and right reference surfaces calculated previously from the template above.
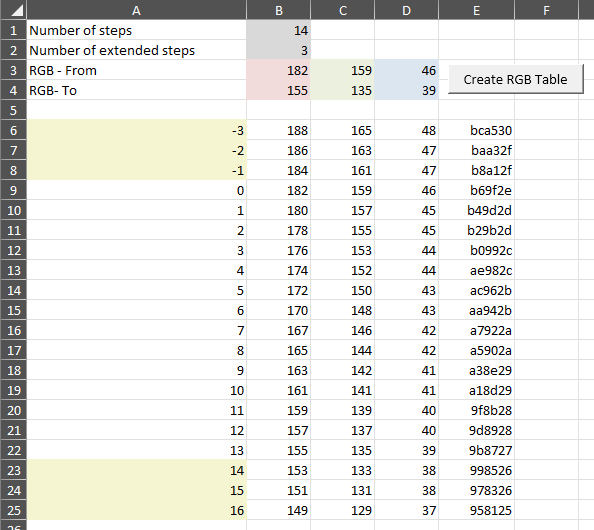
When clicking the "Create RGB Table" button, the spreadsheet automatically generates all RGB values for the complete range of indexes. In this example:
- index -1 corresponds to the left extension,
- indexes 0 to 13 correspond to the main cylindrical surface,
- and index 14 corresponds to the right extension.
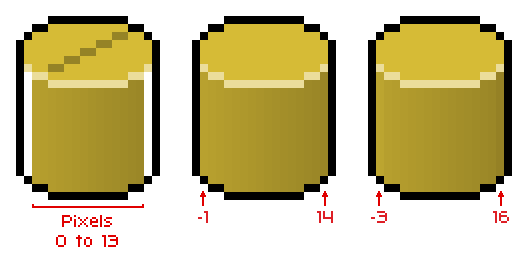
For a more realistic and mathematically accurate result, you can choose the colors corresponding to indexes -2 and 15, or -3 and 16, from the Excel table, depending on the context and the desired visual feel:
Here are two examples of color gradients for which this Excel macro can be used:

The source code of the Excel macro is provided below. Since the algorithm is very simple, it can easily be rewritten in any programming language.
Sub CreateTable()
Dim ColumnRange As String
    Dim RowCount1 As Long
    Dim RowCount2 As Long
    Dim CurrentRow As Long
    Dim i As Long

    Dim IncR As Double
    Dim IncG As Double
    Dim IncB As Double

    Dim HighlightR As Long
    Dim HighlightG As Long
    Dim HighlightB As Long

    ColumnRange = "A:E"
    CurrentRow = 6

    ' Highlight color
    HighlightR = 245
    HighlightG = 245
    HighlightB = 210

    IncR = (Range("B4").Value - Range("B3").Value) / (Range("B1").Value - 1)
    IncG = (Range("C4").Value - Range("C3").Value) / (Range("B1").Value - 1)
    IncB = (Range("D4").Value - Range("D3").Value) / (Range("B1").Value - 1)

    RowCount1 = Range("B1").Value
    RowCount2 = Range("B2").Value

    ' Clear contents, text and background colors from row 6 and below
    With ActiveSheet.Range(ColumnRange).Rows(CurrentRow & ":" & Rows.Count)
        .ClearContents
        .Interior.Pattern = xlNone
        .Font.ColorIndex = xlAutomatic
    End With

    ' Main loop
    For i = -RowCount2 To RowCount1 + RowCount2 - 1
        Cells(CurrentRow, 1).Value = i

        ' RGB
        Cells(CurrentRow, 2).Value = Clamp_Byte(Range("B3").Value + i * IncR)
        Cells(CurrentRow, 3).Value = Clamp_Byte(Range("C3").Value + i * IncG)
        Cells(CurrentRow, 4).Value = Clamp_Byte(Range("D3").Value + i * IncB)

        Cells(CurrentRow, 5).Value = RGB_To_Hex(Cells(CurrentRow, 2).Value, _
                Cells(CurrentRow, 3).Value, Cells(CurrentRow, 4).Value)

        ' Column A background color
        If i < 0 Or i >= RowCount1 Then
            Cells(CurrentRow, 1).Interior.Color = RGB(HighlightR, HighlightG, HighlightB)
        End If

        CurrentRow = CurrentRow + 1
    Next i
End Sub

Function Clamp_Byte(v As Integer) As Integer
    Clamp_Byte = Application.Max(Application.Min(v, 255), 0)
End Function

Function RGB_To_Hex(r As Integer, _
                    g As Integer, _
                    b As Integer) As String

    RGB_To_Hex = LCase("'" & _
        Right("0" & Hex(r), 2) & _
        Right("0" & Hex(g), 2) & _
        Right("0" & Hex(b), 2))
End Function
3D Pixel Art Guide - Part 3
posted on 25 May 2026, updated on 25 May 2026
3D Pixel Art Guide by Bernard Perbal is licensed under a Creative Commons Attribution-ShareAlike 4.0 International License.
When working with an object that features a sloped surface, determining the start and end points of the edge is usually fairly straightforward. The horizontal offset can be calculated directly, while the vertical displacement is obtained using the 1.2649 vertical scaling factor introduced in Part 1 of this guide.
Drawing the edge itself, however, is a completely different matter. In Pixel Art, a mathematically correct line does not necessarily produce a visually convincing result. Achieving a slope that appears both clean and aesthetically balanced can therefore become surprisingly difficult.
In practice, only a small number of precise angles generate pleasing pixel patterns. Certain slopes naturally produce cleaner stair-step sequences, making the edge easier to read and visually more coherent.
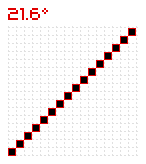
The following example uses a 21.6-degree angle, which tends to give particularly good graphical results. Because of this, when a sloped surface falls within an approximate range of 18 to 24 degrees, it can often be preferable to intentionally represent it using a 21.6-degree slope instead.
While this approach introduces a small loss of angular accuracy, the resulting shape usually feels far more natural and visually harmonious within a Pixel Art environment.
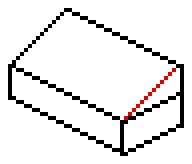
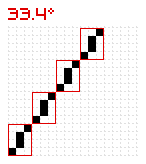
In this other example, the inclined plane has a precise angle of 33.4 degrees. Notice that the edge appears less regular here, but this is the most consistent way to represent this angle:
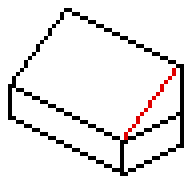
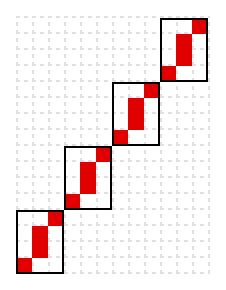
Note that this line is made up of a repeating pattern contained within a 3 * 4 rectangle:
The following table lists all the angles that can be represented using a repeating pattern contained within an x * y rectangle.
It should be noted that the smaller the rectangle, the more regular and visually pleasing the line will appear. In particular, the 13 angles highlighted in green produce smoother and more consistent lines:
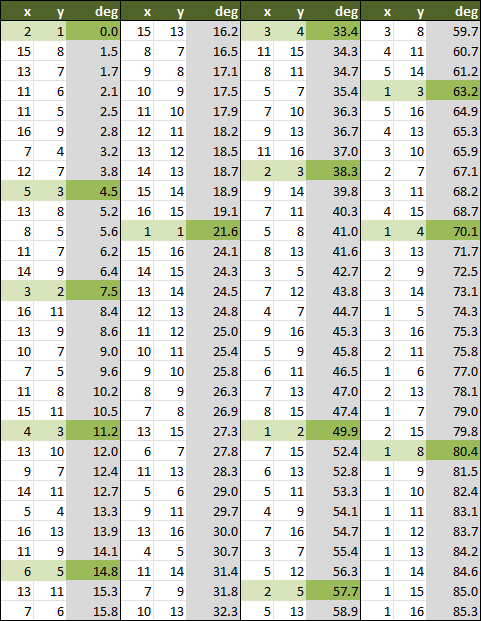
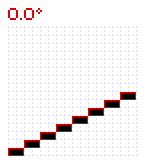
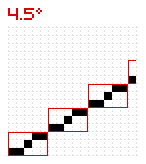
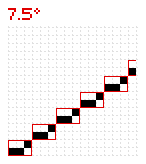
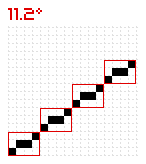
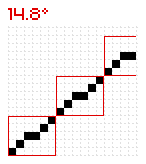
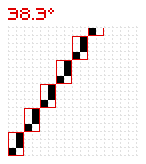
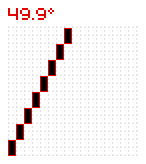
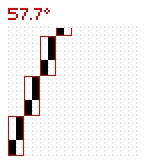
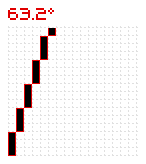
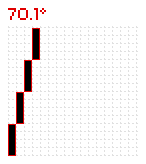
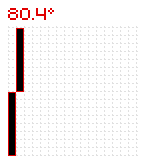
The lines corresponding to these 13 angles are shown in the following example and illustrated in detail within their associated rectangles below. Notice the dimensions of the small red rectangle, whose pixel size corresponds to the x and y columns in the table above.